Skip to content

Insights into Forklift Fatality Statistics from Experts (2026 Update)
Every year, U.S. regulators publish a fresh set of forklift fatality numbers, and every year the headline figure lands somewhere in the mid-70s to mid-80s. That stability is exactly what should worry a warehouse manager — not the number itself, but the fact that it hasn't meaningfully moved in a decade of new training mandates and new safety technology. This article walks through the current statistics, what's actually behind them, and — more importantly — how to use that data to change what happens on your own floor.
1. Why These Numbers Should Matter to You, Not Just to OSHA
It's easy to treat forklift fatality statistics as background noise — a set of national figures that describe an industry-wide problem somewhere out there, not your facility. In practice, national statistics are built entirely from individual incidents at individual sites, and the causes behind them repeat with remarkable consistency from one warehouse to the next. When you understand which failure modes make up the bulk of the data, you know exactly where to point your training budget, your layout changes, and your technology spend before your own facility becomes one of next year's data points.
This guide is written for warehouse managers, EHS coordinators, and operations leads who want more than a list of numbers — a way to read the data and act on it.
2. The Latest Forklift Fatality Numbers
According to the National Safety Council's most recent injury data, forklifts were identified as the source of 84 work-related deaths in 2024, alongside an estimated 25,110 nonfatal injuries across 2023–2024. OSHA's long-cited estimate — used consistently in its own outreach materials for years — puts the annual toll at roughly 85 deaths, with an estimated 34,900 forklift-related injuries serious enough to require medical treatment each year.
The Bureau of Labor Statistics revised its injury and illness classification system starting with 2023 data, which means year-over-year comparisons across the revision should be treated with some caution. The consistent takeaway across every methodology, old and new, is the same: the annual toll sits stubbornly in the 70s-to-80s range and hasn't shown a real, sustained decline.
3. The Ten-Year Trend: Is Forklift Safety Actually Improving?
Looking at a single year in isolation hides the more useful story, which is the trend. Pulled together from BLS and National Safety Council reporting, recent annual fatality counts look like this:
| Year | Reported Forklift Fatalities (U.S.) | Source |
|---|---|---|
| 2017 | 74 | BLS |
| 2018 | 85 (decade peak) | MHEDA / BLS |
| 2020 | 78 | NSC |
| 2022 | 73 | BLS / NSC |
| 2024 | 84 | NSC (post-classification update) |
Notice the shape of that trend: it isn't climbing steadily, and it isn't falling steadily either — it's oscillating within a fairly narrow band. That's a meaningfully different story than "forklift safety is getting worse," but it's also a long way from "forklift safety is solved." Warehouse footprint, e-commerce order volume, and total forklift operating hours have all grown substantially over the same period, so a flat headline count can mask a real improvement in the underlying rate per hour operated at facilities that have invested in training and technology — while sites that haven't invested are quietly keeping the national average exactly where it's always been.
4. What's Actually Killing Forklift Operators
The value of fatality statistics isn't the headline count — it's the breakdown of causes underneath it, because that's the part you can actually act on.
- Overturns (tip-overs) — roughly 42% of fatalities. This remains the single largest cause. Most overturn deaths happen when the operator attempts to jump clear of a tipping truck and is crushed instead of staying belted in and riding it down, as trained operators are taught to do.
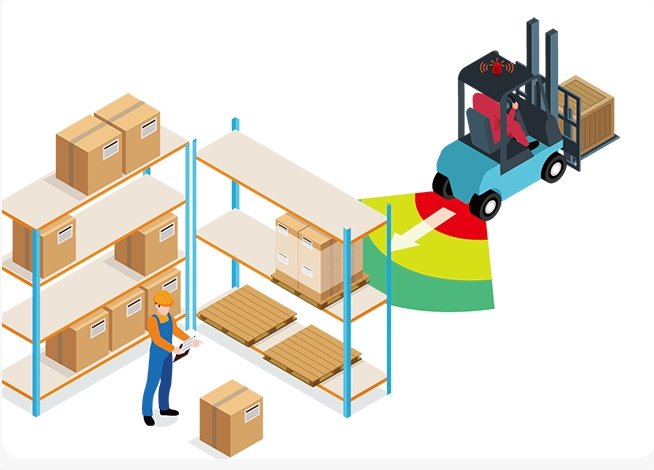
- Pedestrian strikes — roughly 36% of fatalities. A worker on foot is struck, most often at a blind corner, an intersection with no sightline, or during a reversing maneuver where the operator's field of view is blocked by the load or the mast.
- Falls to a lower level. Frequently linked to unauthorized personnel-lifting on forks, or operation near loading dock edges without proper restraint systems.
- Struck by falling load or objects. Overloading, improper load securing, or exceeding the rated capacity for a given load center.
- Forklift-to-forklift and forklift-to-powered-vehicle collisions. Concentrated at shared intersections and staging points where multiple trucks converge on predictable, repetitive routes.
Overturns and pedestrian strikes together account for the clear majority of forklift deaths, and both share the same underlying weakness: a split-second where the operator either can't see the hazard in time or can't recover from a mistake already in motion. That's a visibility and reaction-time problem as much as it is a training problem — which is exactly why training alone hasn't been enough to move the national number.
5. Industry Snapshot: Where the Risk Concentrates
Forklift fatalities aren't spread evenly across industries. Manufacturing has historically carried the largest share of forklift deaths (around 42% historically), with construction next (roughly 24%), and trade, transportation, and warehousing close behind. What's shifted in recent years is exposure: the rapid growth of e-commerce fulfillment has pushed warehousing employment and forklift operating hours up sharply, which means warehousing's share of the national total is one of the categories worth watching most closely going forward, even where its historical ranking hasn't changed.
6. What the Statistics Don't Tell You
National statistics are useful for spotting patterns, but they flatten a lot of nuance that matters at the facility level. A few gaps worth understanding before you apply the numbers to your own operation:
- They count deaths, not near-misses. For every fatality, there are far more incidents that came close and were never formally logged — which means the "leading causes" list is really describing the tip of a much larger pattern happening on your floor right now.
- They're a national average, not your facility's risk profile. A single-shift, narrow-aisle manufacturing floor and a 24/7 high-throughput distribution center face very different odds even though both get folded into the same OSHA figure.
- They lag reality. Published fatality data is typically a year or more behind, so the number you're reading today reflects operating conditions from before your most recent equipment or layout changes.
- The "70% preventable" figure is a directional estimate, not a lab measurement. It's widely cited because it's directionally correct — human factors and workplace design drive most incidents — but it shouldn't be read as a precise, footnoted statistic.
Want to see where pedestrian detection technology fits into a prevention program?
Talk to a Specialist7. Cause vs. Root Driver vs. Most Effective Control
The most practical way to use fatality statistics is to connect each leading cause to what's actually driving it, and then to the control that closes that specific gap — rather than applying the same generic "more training" answer to every row.
| Leading Cause | Root Driver | Most Effective Control |
|---|---|---|
| Overturns | Excessive turning speed, off-center or overloaded loads, uneven surfaces | Speed limiting in turns, stability training, load-center awareness, seatbelt enforcement |
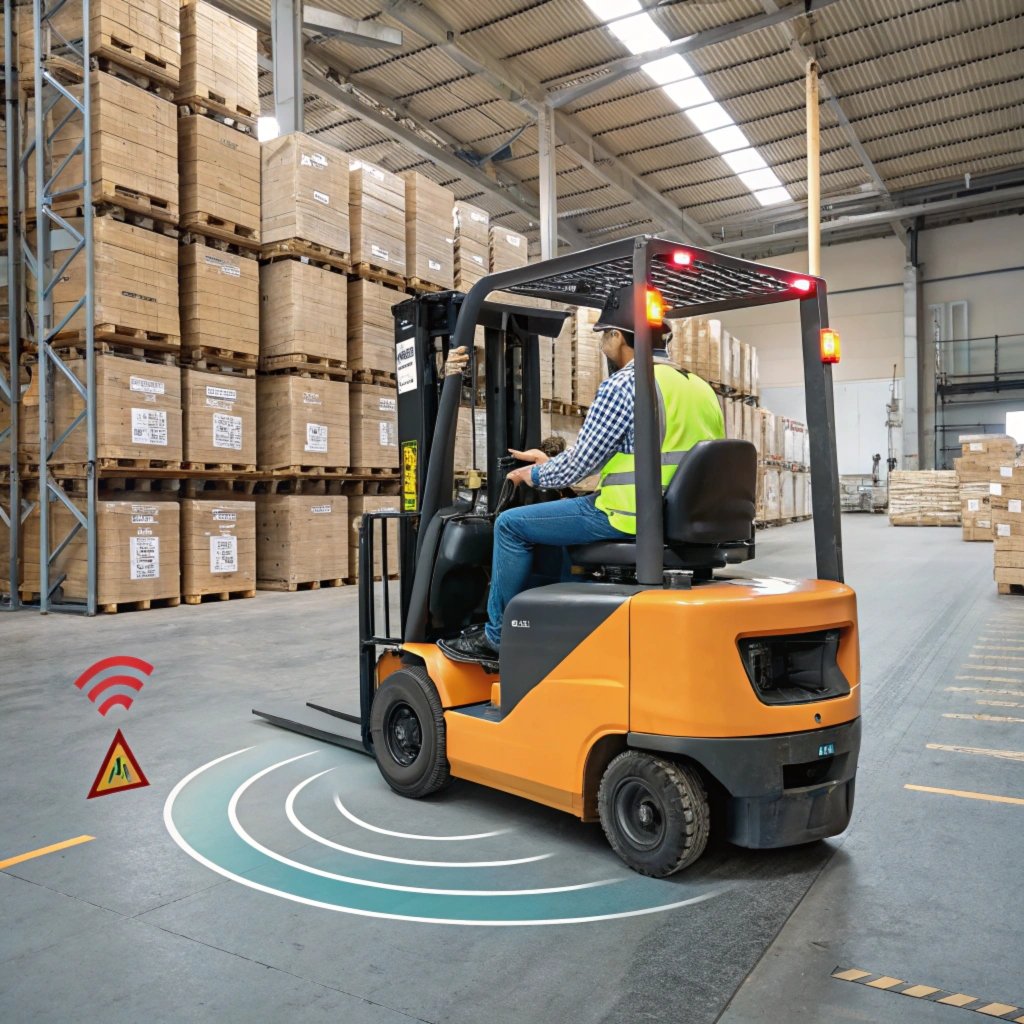
| Pedestrian strikes | Blind corners, poor sightlines, task-focused pedestrians not watching for trucks | Active pedestrian detection systems, physical path separation, mirrors at low-speed corners |
| Falls to a lower level | Unauthorized personnel lifting, dock-edge operation without restraints | Strict policy enforcement, dock restraint systems, supervisory spot checks |
| Struck by falling load | Overloading, improper securing, exceeding rated load center | Load charts posted and enforced, on-truck weighing/scale systems, pre-shift load checks |
| Forklift-to-forklift collisions | Shared intersections, predictable repetitive routes, limited cross-visibility | Proximity warning systems, marked intersections, staggered traffic scheduling |
8. Turning These Numbers Into an Action Plan
Statistics are only useful if they change what happens on Monday morning. Here's a straightforward way to translate the data above into a working plan without waiting for a full annual safety review cycle:
- Pull your own incident and near-miss log for the last 12 months and sort it against the same two categories that dominate the national data — overturns and pedestrian strikes. If either shows up more than once at the same location, that location is your priority.
- Walk your highest-traffic intersections with both an operator's and a pedestrian's line of sight, and flag every point where visibility drops below roughly 10–15 feet.
- Check refresher training cadence against OSHA's requirement — every three years at minimum, plus immediate retraining after any near-miss, unsafe-operation observation, or change in equipment or attachment.
- Match each flagged location to a control from the table above rather than defaulting to a blanket policy — a blind corner needs a different fix than an overloading problem.
- Re-check in 90 days. A near-miss log that goes quiet at a previously flagged location is your clearest sign a fix is actually working.
Reduce Your Facility's Forklift Risk Before It Becomes a Statistic
We design AI-powered pedestrian detection, proximity warning, and speed-control systems built to close the exact gaps behind the two leading causes of forklift fatalities.
Get a Free Safety Review9. Mistakes Managers Make When Reading Safety Data
- Treating a flat national trend as "safety is fine." A number that isn't rising isn't the same as a number that's low enough.
- Applying national industry rankings directly to a single facility without checking whether your own shift pattern, layout, and traffic density actually match the average.
- Reacting only to fatalities and serious injuries instead of treating near-misses as the leading indicator they actually are.
- Assuming training alone closes the gap on causes — like blind-corner pedestrian strikes — that are fundamentally about visibility and timing, not knowledge.
- Waiting for the annual safety review to act on a pattern that's already visible in this month's incident log.
10. Frequently Asked Questions
Tap a question to expand the answer — tap again to collapse it.
Recent U.S. data from the National Safety Council puts forklift-related workplace deaths at 84 in 2024. OSHA's long-standing estimate, cited for years, is roughly 85 deaths annually, while yearly BLS counts have ranged from the low 70s to the mid-80s over the past decade. The number moves a little year to year, but it has not shown a real downward trend.
Forklift overturns, or tip-overs, are consistently identified as the largest single cause, historically linked to around 42% of forklift fatalities. Pedestrian strikes are the second leading cause, linked to roughly 36% of deaths. Together these two failure modes account for the large majority of forklift-related deaths.
Manufacturing has historically recorded the highest share of forklift fatalities, followed by construction and warehousing/transportation. Warehousing and e-commerce fulfillment have grown fastest in exposure over the past several years, so their share of both injuries and fatalities has been rising even where the historical ranking hasn't changed.
OSHA has estimated that around 70% of forklift accidents could be prevented through proper training, inspection, and safe operating procedures. That figure is widely cited but should be read as a directional estimate rather than an exact measurement — the underlying point, that human factors and workplace design drive most incidents, holds up well against the cause-of-death data.
Fleet size, warehouse footprint, and e-commerce order volume have all grown substantially, so a flat fatality count can still represent a real improvement in the rate per operating hour. It also reflects uneven adoption: sites that pair training with engineering controls like pedestrian detection and stability systems see measurably fewer incidents than sites relying on training alone, but adoption of those controls is still far from universal.
Start by mapping your own near-miss and incident log against the two leading causes — overturns and pedestrian strikes — rather than reacting to the national statistics in the abstract. Identify your highest-traffic blind corners and your most frequently loaded/turned routes, then prioritize engineering controls and retraining at those specific points first.
Related Reading
See how pedestrian detection systems close the blind-corner gap, how a forklift camera compares to mirrors for blind-spot coverage, or run your own warehouse risk assessment to score these risks at your facility.